Introduction
Every Product Manager tracks numbers.
But only a few know which metrics actually move the product forward.
You’ve seen dashboards filled with DAU, stickiness, churn, MRR, roadmap velocity, and sentiment scores. PMs present these metrics in reviews, yet still struggle to answer:
Are users truly adopting and loving our product?
Is this roadmap driving retention or just shipping features?
Are we building value or just increasing output?
Is our product truly healthy or just active?
Most PMs don't struggle with data,
They struggle with interpretation and alignment.
Great PMs don’t just report metrics.
They turn metrics into insight, and insight into action.
This guide is not just a list of metrics.
It’s a decision-making framework to help you apply each KPI the way high-performing PMs do in leadership conversations, roadmap planning, pricing strategy, user growth, and retention design.
What Are Product Management KPIs Really?
PM KPIs are not just numbers on dashboards.
They are leading signals that help PMs:
Detect product health early
Prioritize features based on value, not gut feeling
Validate assumptions with real user behavior
Align stakeholders around measurable outcomes
Predict growth, risk, or stagnation before it happens

KPIs turn Product Management from guessing → learning → leading.
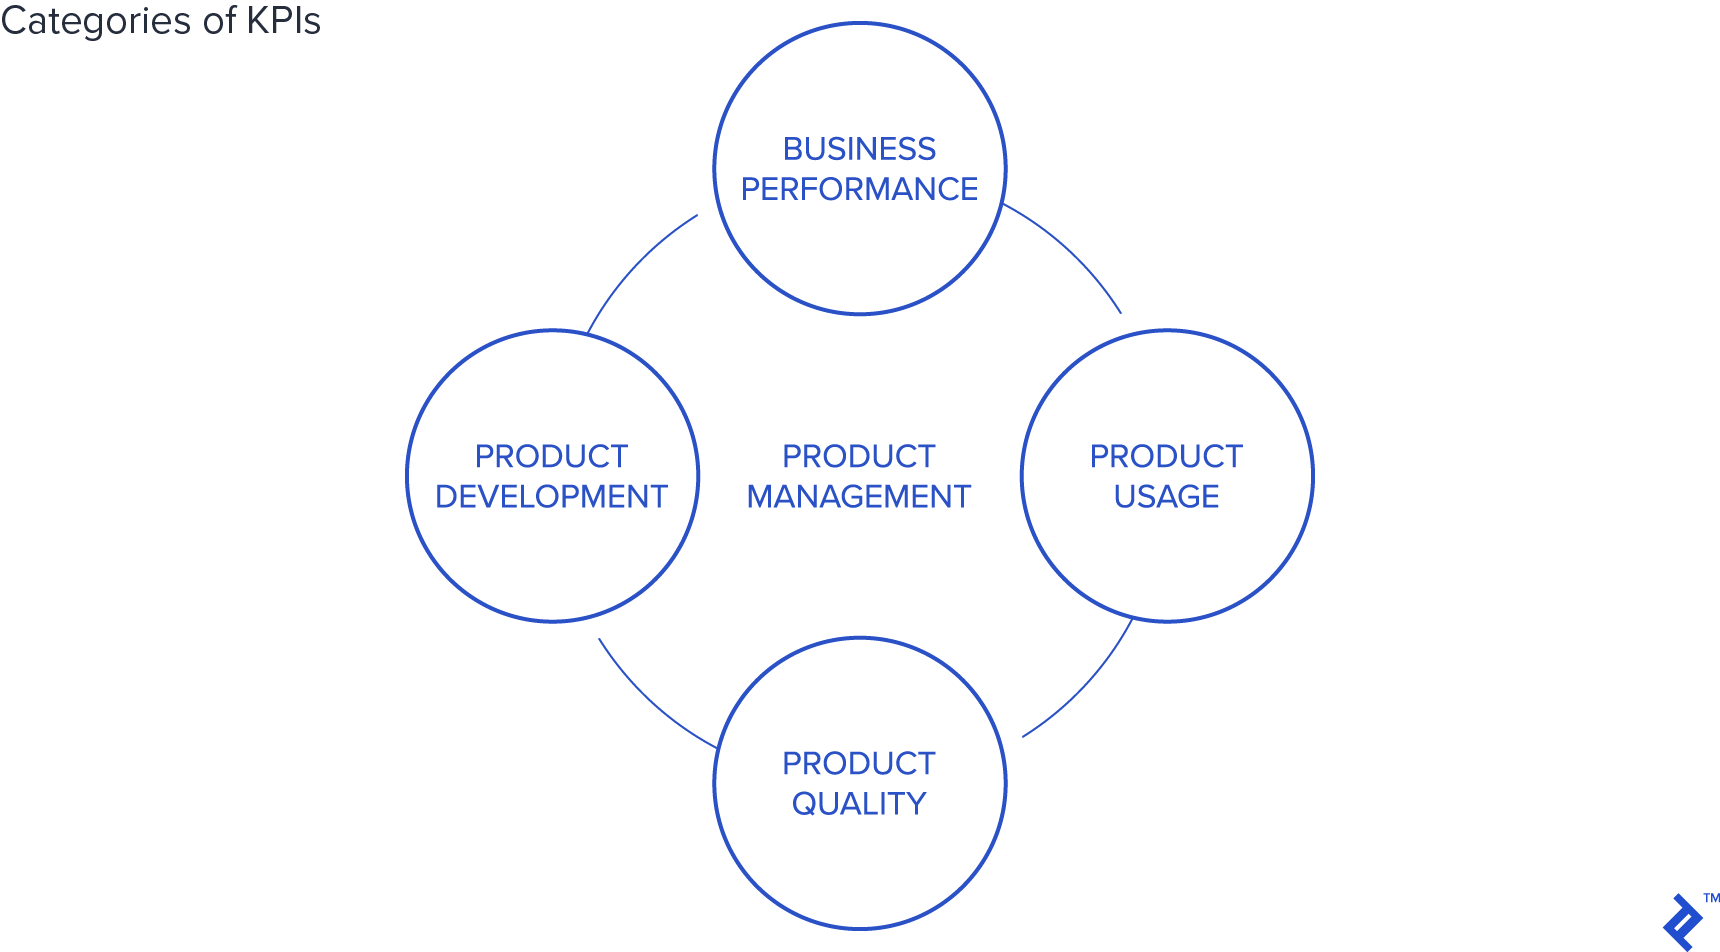
4 KPI Categories That Define Product Health
| KPI Category | What it Reveals |
| Usage | Are users coming back? Are they forming habits? |
| Experience | Are customers satisfied? Is trust increasing? |
| Delivery | Can we ship meaningful work fast and predictably? |
| Business | Are we generating sustainable revenue and retention? |
Great PMs don’t track all metrics.
They track the right metric based on their growth stage, product maturity, and customer journey.
The 10 Essential KPIs for Product Managers in 2026 (With Strategy & Examples)
1 Trial Drop-Off Rate
Does your product deliver value fast enough?
This KPI measures how many users abandon a trial before experiencing your “aha” moment of your real product value.
Formula:
Trial Drop-Off Rate = (Trial users who quit early / Total trial sign-ups) × 100
High Drop-Off Means:
Onboarding isn’t clear
Users can't find value quickly
UI complexity creates frustration
Fix With:
Progressive onboarding
Guided product tours (like UserGuiding, Appcues)
Feature gating based on intent
Real Example:
Netflix and Canva both reduced trial drop-off by showing value within the first 60 seconds through immediate creation experience.
2 Customer Acquisition Cost (CAC)
Are we acquiring customers affordably?
CAC tells you how much you spend to acquire a paying customer.
Formula:
CAC = Total marketing and sales costs / Number of new customers acquired
PM Insight:
CAC doesn’t tell you success.
CAC only matters when compared to LTV (Lifetime Value).
Healthy growth ratio: LTV ≥ 3 × CAC
Lower CAC through:
Referral programs
Freemium model
AI-powered acquisition funnels
3 DAU/MAU Ratio (Stickiness Metric)
Do users keep coming back or just visit once?
This KPI reveals product habit strength.
Formula:
(DAU / MAU) × 100
Interpretation:
➡ 15–20% → Mild engagement (utility tools)
➡ 30–40% → Good stickiness (SaaS, productivity)
➡ 50%+ → Strong product habit loop (WhatsApp, Slack, Instagram)
Most PMs track DAU & MAU separately.
Smart PMs track the ratio of the habit signal.
4 Customer Lifetime Value (LTV)
Are customers a one-time purchase or long-term value?
Formula:
LTV = Average purchase value × Frequency × Customer lifespan
Why It Matters:
Helps decide marketing budget
Identifies valuable user segments
Helps in pricing and subscription strategy
Example:
Spotify’s premium users have 3× higher LTV due to long-term loyalty reinforced by playlists, recommendations, and personalization.
5 Support Tickets vs Escalations
Are we creating value or creating tickets?
Tracking tickets shows friction.
Tracking escalations shows critical pain points.
Tickets rising → usability and UX issues
Escalations rising → system, reliability, trust issues
Why It's Useful:
✔ Helps visualize “ where customers struggle most”
✔ Connects Product and Support teams
✔ Reveals hidden UX friction that analytics miss
6 On-Time Delivery Rate
Are we delivering when we said we would?
Formula:
On-Time Delivery Rate = (On-time deliveries / Total planned deliverables) × 100
Why PMs Track This:
✔ Alignment with business roadmap
✔ Avoids credibility loss in leadership reviews
✔ Prevents engineering burnout from pressure resets
Great PMs don’t just track speed they track predictability.
7 Team Velocity
How effectively is the team converting effort into output?
Formula:
Velocity = Completed story points per sprint
Use Velocity To:
✔ Plan sprints and releases
✔ Compare work across cycles
✔ Reveal bottlenecks in team efficiency
Common Misuse:
Velocity is not a measure of speed,
It's a measure of reliability and planning accuracy.
8 Customer Churn Rate
Are customers leaving and why?
Formula:
Churn Rate = (Customers lost / Customers at start of period) × 100
Churn Insights:
🔻 Product-market fit problems
🔻 Onboarding failure
🔻 Pricing dissatisfaction
🔻 Lack of continuous value
More powerful when paired with:
✔ Exit surveys
✔ NPS
✔ Cohort retention
9 Monthly Recurring Revenue (MRR)
How stable and predictable is our revenue?
Formula:
MRR = Σ (Subscription price × Number of paying users)
Why It Matters:
✔ Tracks revenue momentum
✔ Helps forecast product scale
✔ Supports decision-making in pricing models
Smart PMs pair MRR with:
➡ Expansion MRR (upsells)
➡ Contraction MRR (downgrades)
➡ Net Revenue Retention
10 Net Promoter Score (NPS)
Do customers trust and recommend your product?
Formula:
NPS = % Promoters − % Detractors
What NPS tells you:
✔ Product advocacy
✔ Brand strength
✔ Word-of-mouth potential
Hack: Pair NPS with feature usage data to see
➡ Which features create promoters?
➡ Which ones produce detractors?
Align KPIs with Product Stage - Strategy Over Quantity
| Product Stage | Most Relevant KPIs |
| Launch | Trial Drop-Off, Activation, CAC |
| Growth | DAU/MAU, Retention, LTV |
| Scale | MRR, NPS, Churn, Expansion Revenue |
| Maturity | Velocity, On-Time Delivery, Support Escalations |
You don't need all the metrics. You need the right metric at the right time.
If you want to shift from execution to strategy, start thinking like a Product Manager.
Stop just building features - start solving real user problems.
Make decisions, influence vision, and build products that matter.
📘 The Product Management Handbook - your roadmap to think, lead, and succeed like a PM.
In 2026, Product Managers won’t be valued for the number of metrics they report
but for the depth of insight and clarity of decisions those metrics help them make.
A spreadsheet of numbers ≠ Product insight.
Insight comes from knowing what to track, why, and what to do next.
The best PMs won’t just track product performance
They will predict it, influence it, and shape it.


.png&w=1200&q=75)