Product analytics is the process of collecting, analyzing, and interpreting data about how users interact with a product. It's a crucial aspect of product management that enables data-driven decision-making and continuous improvement.
Now with the fast competition, product analytics has become a crucial tool for product managers. It provides insights into user behavior, preferences, and pain points, allowing teams to make informed decisions about product development and optimization.
Key benefits of product analytics include
- Improved user experience by understanding user behavior and preferences to tailor experiences.
- Increased user engagement and retention by identifying what keeps users coming back.
- More efficient resource allocation with a focus on high-impact areas.
- Data-driven feature prioritization means prioritizing features that provide the most value.
- Better understanding of the customer journey as you can map out user interactions and identify pain points.
- Increased ROI on product development efforts by investing in features that drive revenue.
Basics of Product Analytics
Key Metrics and KPIs for a product
Before we begin, let’s understand the basic difference between product metrics and KPIs. Product metrics are all the data points on how users interact with your product, while KPIs are the most important metrics that tell you if your product is meeting your business goals.
A few of the important product metrics that are measured throughout the growth lifecycle of the product are:
Acquisition metrics:
- New users: Number of new users acquired over a period.
- Traffic sources: Where users are coming from (e.g., organic, paid, referral).
- Conversion rates: Percentage of visitors who take a desired action (e.g., sign-up).
Engagement metrics:
- Daily/Monthly Active Users (DAU/MAU): Number of users who engage with the product daily or monthly.
- Session duration: Average time users spend in a session.
- Feature usage: Frequency and extent of specific feature use.
Retention metrics:
- Churn rate: Percentage of users who stop using the product over a period.
- Retention rate: Percentage of users who return to the product.
- Lifetime value (LTV): Total revenue expected from a user over their lifetime.
Revenue metrics:
- Average Revenue Per User (ARPU): Revenue generated per user.
- Customer Acquisition Cost (CAC): Cost to acquire a new user.
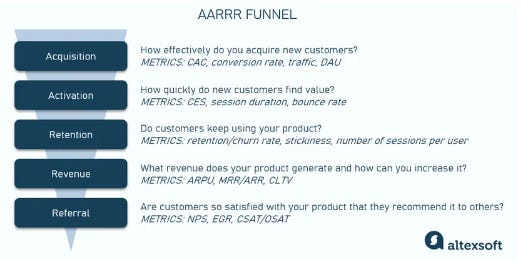
Image credit: Alexsoft
Quantitative vs. Qualitative data
- Quantitative data: Numerical data that can be measured and analyzed statistically (e.g., user counts, time spent, conversion rates). This data is essential for identifying trends and patterns at scale.
- Qualitative data: Non-numerical data that provides insights into user motivations, opinions, and experiences (e.g., user feedback, interviews, surveys). This data helps understand the "why" behind user behavior.
Data Collection Methods
There are several ways by which you can collect product data, a few of them are:
- Event tracking: Capturing specific user actions within the product (e.g., clicks, form submissions).
- User attributes: Collecting demographic and behavioral data about users (e.g., age, location, purchase history).
- Session recording: Capturing user interactions for in-depth analysis (e.g., screen recordings).
- Surveys and feedback forms: Gathering direct user input (e.g., satisfaction surveys, NPS surveys).
- Heatmaps and click maps: Visualizing user interactions on web pages to identify popular and ignored areas.
Essential Product Analytics Tools
There are a variety of analytics tools available, below is an introduction to a few of the most popular ones in the product management industry with the comparison of features, their use cases, and how to choose one for your toolkit.
Popular tools
- Google Analytics is a web analytics platform with robust tracking capabilities. It’s best for web traffic analysis and basic user behavior tracking. It's widely used and integrates well with other Google products.
- Mixpanel is an event-based analytics tool for mobile and web applications. It excels in event-based tracking and funnel analysis, allowing detailed tracking of user interactions and conversion pathways.
- Amplitude is a product analytics platform with advanced user behavior analysis. It’s a strong tool for user behavior analysis and cohort comparisons, providing deep insights into user retention and engagement.
- Pendo is a combined analytics and user feedback platform. It is ideal for in-app guidance and combining analytics with user feedback, helping teams understand user behavior and sentiment.
- Heap automatically captures events and retroactive analysis tools. It is great for retroactive analysis and minimal setup requirements, as it automatically captures all user interactions.
image credit: uxcam
Tips for tool selection
Before you choose an analytics tool, make sure you consider the following:
- Assess your specific needs and use cases. Understand what you need to track and analyze.
- Consider integration capabilities with your tech stack. Make sure the tool can integrate with your existing systems.
- Evaluate the ease of use and learning curve. Choose a tool that your team can quickly adopt and use effectively.
- Look for scalability to accommodate growth. Select a tool that can grow with your user base and data needs.
- Compare pricing models and long-term costs. Consider the total cost of ownership.
- Check for data privacy and security features. Ensure the tool complies with relevant regulations and safeguards user data.
Setting Up Your Analytics Framework
Now that you have your analyzing data and the right analytics tool for your product, setting up a framework helps you stay aligned and focused on your goals
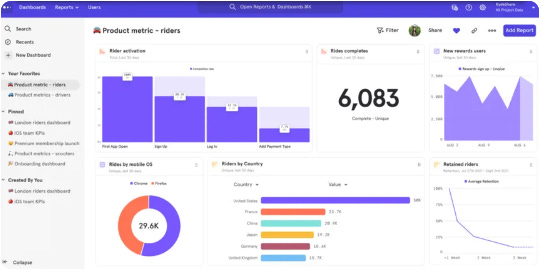
image credit: breadcrumbs
Defining goals and objectives
- Align analytics goals with overall business objectives and ensure your analytics efforts support your strategic goals.
- Identify key questions you want to answer about your product. Don’t try to answer all the questions at once, focus on what you need to know to improve the product.
- Determine the decisions you'll make based on the data, which means define how you'll use the insights you gain, and what are you going to do with them.
Choosing the right metrics
- Select metrics that directly relate to your goals and the stage your product is in.
- Focus on actionable metrics rather than vanity metrics.
- Consider both leading and lagging indicators. Use leading indicators to predict future performance and lagging indicators to measure outcomes.
Creating a measurement plan
- Define events and user attributes to track. Specify the key actions and characteristics to monitor.
- Create a tracking plan document. Outline what, where, and how you'll track data.
- Implement tracking code or integrate analytics SDK (set up the necessary technical components to capture data).
- Try to setup a regular cadence for frequent check-ins to review and interpret data.
Actionable Insights from Data
Interpreting data trends
- Look for patterns and correlations in user behavior. Identify trends that reveal how users interact with your product.
- Identify anomalies or outliers in your data and investigate to understand their root causes.
- Use statistical analysis to confirm the significance of observed trends.
- Consider contextual factors such as market conditions or seasonal trends that may influence data.
Identifying opportunities for improvement
- Analyze pain points in the user journey. Find areas where users encounter difficulties and seek solutions.
- Look for features with low adoption but high impact. Identify underutilized features that have the potential to significantly enhance user experience.
- Identify user segments with potential for growth. Focus on segments that show promise for increased engagement or revenue.
- Evaluate competitor performance and market trends. Benchmark against competitors and stay informed about industry developments.
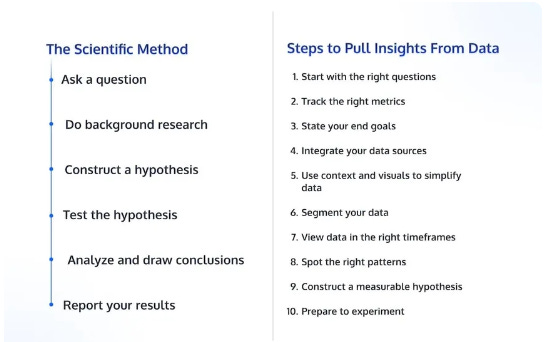
image credit: convert
Data-driven decision making:
- Use data to prioritize product roadmap items. Make informed decisions about which features to develop or enhance.
- Make resource allocation decisions based on ROI potential. Allocate resources to areas with the highest return on investment.
- Validate or challenge assumptions with data. Use data to test and refine assumptions about user behavior and preferences.
- Continuously test and iterate based on analytics insights. Maintain a cycle of testing, learning, and iterating to continuously improve the product.
Communicating Analytics Insights
After you have extracted the insights from your data, you’ll need to communicate it with multiple stakeholders and your team.
Creating effective dashboards:
- Design clean, visually appealing layouts and make sure the dashboards are easy to understand and use.
- Focus on key metrics and actionable insights. Highlight the most important data points and insights.
- Use appropriate chart types for different data types. Carefully select charts that best represent the data being displayed.
- Include filters and drill-down capabilities for deeper analysis to allow users to explore data in more detail.
Storytelling with data:
- Connect data points to their implications in the context of users or the business impact.
- Use narrative structures, craft stories to make data engaging and more memorable.
- Combine quantitative data with qualitative insights. Enhance data with user stories and feedback.
- Highlight the "so what" and "now what" of your findings, which means clearly articulate the implications of the data and the recommended actions.
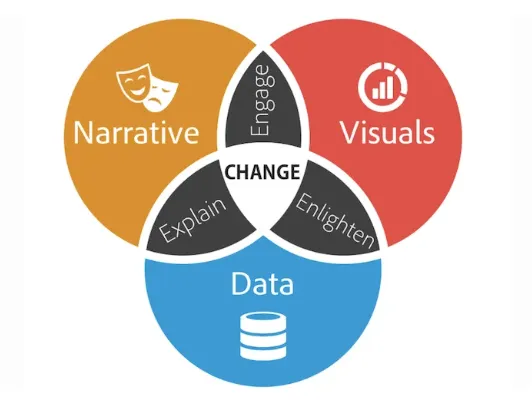
image credit: wordstream
Common Challenges and Solutions
Dealing with data quality issues:
- Implement data validation processes to regularly check data for accuracy and consistency.
- Regularly audit and clean your data. Performing this routine data hygiene is important to remove errors and inconsistencies.
- Use data governance practices to maintain consistency. Create standards and protocols for data management in your company.
- Educate team members on proper data collection techniques. Everyone involved must understand data collection best practices.
Overcoming analysis paralysis:
- Set clear objectives for each analysis. Defining what you aim to achieve with each data analysis effort is a must.
- Limit the number of metrics you focus on. Avoid being overwhelmed by focusing on the most impactful metrics. It’s crucial but not the only thing that you need to focus on.
- Establish decision-making frameworks. Create processes that guide decision-making based on data insights.
- Set time limits for analysis before taking action, Avoid endless analysis by setting deadlines for decision-making.
Balancing quantitative and qualitative insights:
- Let user feedback and qualitative insights guide your data exploration, and use that data to generate hypotheses.
- Then validate qualitative insights with quantitative data. Confirm patterns observed in qualitative data with quantitative analysis.
- Combine user feedback with usage data for a complete picture i.e. integrate both data types to get a holistic view of user behavior.
- Conduct mixed-method research when appropriate. You need to use both quantitative and qualitative methods in your research efforts.
Key takeaways for product managers:
- Product analytics is essential for data-driven product management. It provides the insights needed to make informed decisions.
- Focus on actionable metrics aligned with business goals. Ensure your analytics efforts are tied to strategic objectives.
- Choose the right tools and set up a robust analytics framework. Select tools that meet your needs and establish a solid foundation for data collection and analysis.
- Analyze user behavior, feature performance, and customer segments. Use data to understand and improve user interactions with your product.
- Communicate insights effectively and drive decision-making with data. Present data in a way that informs and persuades stakeholders.