Why Product Metrics Matter
A product manager’s role is deeply intertwined with decision-making. Whether it’s prioritizing new features, fixing usability issues, or optimizing revenue, every decision needs to be backed by metrics that matter.
Metrics transform intuition into a structured, measurable approach to product strategy. For example imagine you’re leading the development of a new AI-powered feature for your product. You launch it with excitement, expecting massive adoption. However, after a few weeks, you notice that user engagement isn’t as high as anticipated. What do you do?
You could make random guesses - maybe users don’t understand the feature, or perhaps they don’t see its value. But without data, your next move would be based on assumptions rather than informed decision-making.
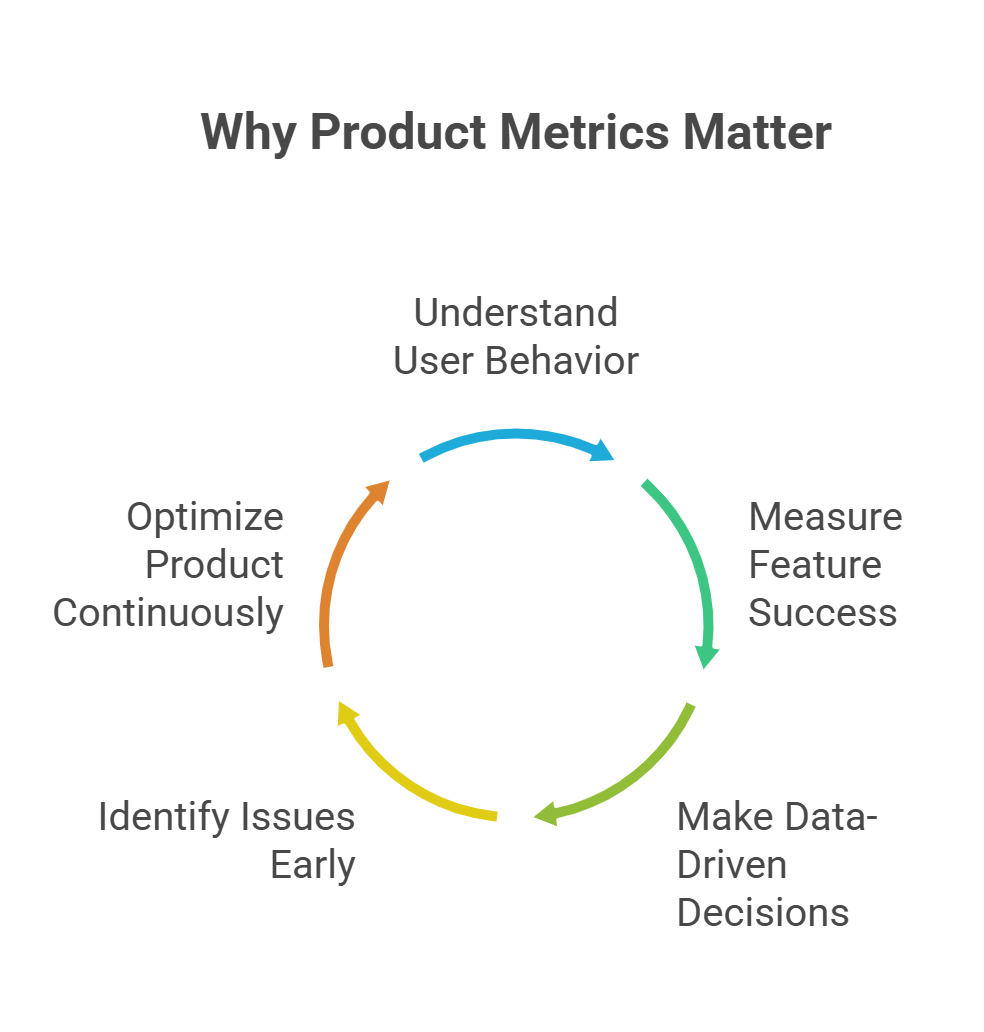
This is where product metrics become invaluable. They help product managers:
- Understand user behavior and how people interact with the product
- Measure the success of new features and overall product health
- Make data-driven decisions instead of relying on gut feelings
- Identify issues early and optimize the product continuously
In this guide, we’ll break down different types of product metrics, when to use them, and how to apply them in a practical, actionable way.
Types of Product Metrics
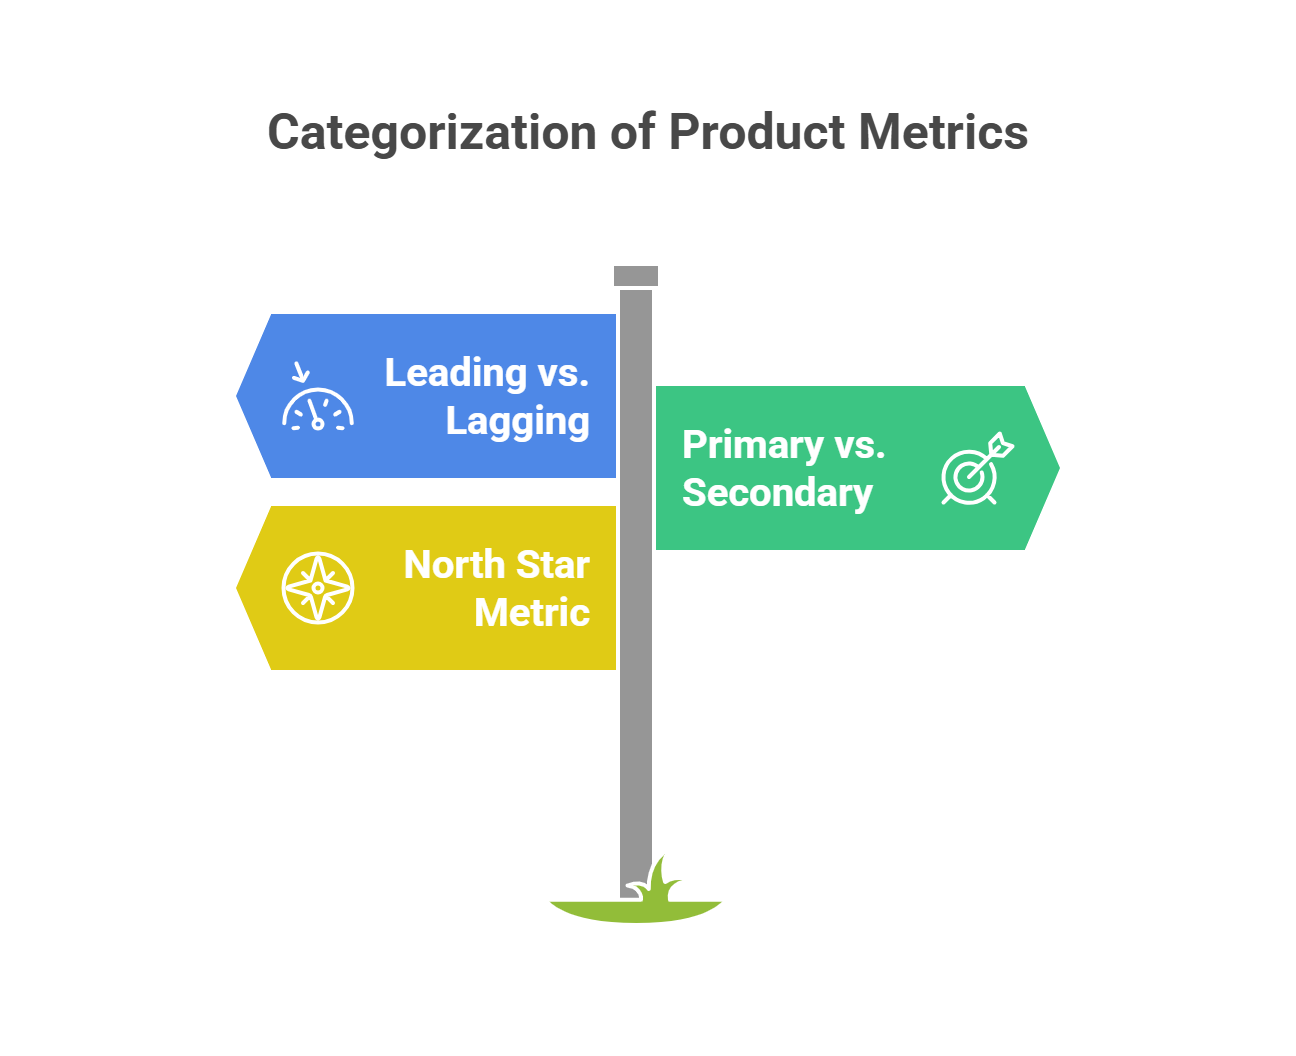
Product metrics serve two key purposes: measuring performance and guiding decisions. To make sense of the many metrics we track, it's helpful to understand two different but complementary ways of categorizing them: leading vs. lagging, and primary vs. secondary. Let’s break them down:
1. Leading vs. Lagging Metrics
- Leading metrics are early indicators. They help predict future outcomes and are useful for identifying trends before results are fully realized.
- Example: Number of free-trial signups predicts future paid conversions.
- Lagging metrics are outcome-based. They show the results of actions that have already occurred.
- Example: Monthly Recurring Revenue (MRR) shows revenue trends over time.
Best practice: Use leading metrics for proactive decision-making and lagging metrics to evaluate long-term impact.
2. Primary vs. Secondary Metrics
- Primary metrics are your main Key Performance Indicators (KPIs). These are directly tied to the product’s strategic goals and success.
- Secondary metrics provide supporting data. They offer context or help explain what’s driving the primary metrics.
How They Work Together
Leading and lagging metrics can be either primary or secondary, depending on the context:
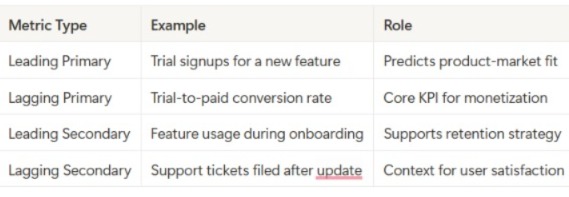
In short:
Leading/lagging refers to timing and causality.
Primary/secondary refers to importance and focus.
Understanding how these categories interact helps product teams prioritize what to measure, when to measure it, and how to interpret the results.
2. North Star Metric (NSM)
A North Star Metric (NSM) is the single most important metric that represents product success. It should:
- Reflect long-term business growth
- Align with user value
- Drive strategic decision-making
Examples:
- Airbnb → Nights booked (more bookings = more revenue and host engagement)
- Slack → Messages sent per team (higher engagement = product stickiness)
- Spotify → Minutes streamed (more streaming = better user retention)
Best Practice: Choose an NSM that aligns with your product’s value proposition, and let it inform both strategic and tactical decisions.
Determining Which Metrics Matter When
Not every metric is useful at every stage or for every stakeholder. The key is to choose the right metrics based on the product lifecycle and the needs of different teams:
- Early-stage Products: Focus on acquisition, activation, and engagement. You want to understand how users discover your product and their first interactions.
- Growth-stage Products: Shift attention to retention and conversion. At this point, it’s critical to see whether users are staying and taking actions that drive revenue.
- Mature Products: Emphasize monetization, optimization, and efficiency. Here, expanding user value and reducing churn become paramount.
Different stakeholders care about different metrics:
- Executives: Look at revenue metrics, growth rates, and overall market share.
- Marketing Teams: Zero in on acquisition, conversion rates, and traffic sources.
- Engineering: Focus on performance metrics, bug rates, and product uptime.
- Customer Success: Track churn, retention, and customer satisfaction scores (CSAT).
Aligning the right metrics with the right teams ensures that everyone is working towards the same business outcomes. A product manager needs to balance these perspectives and define the right success metrics for each phase of the product lifecycle.
15 Key Product Metrics & How to Use Them
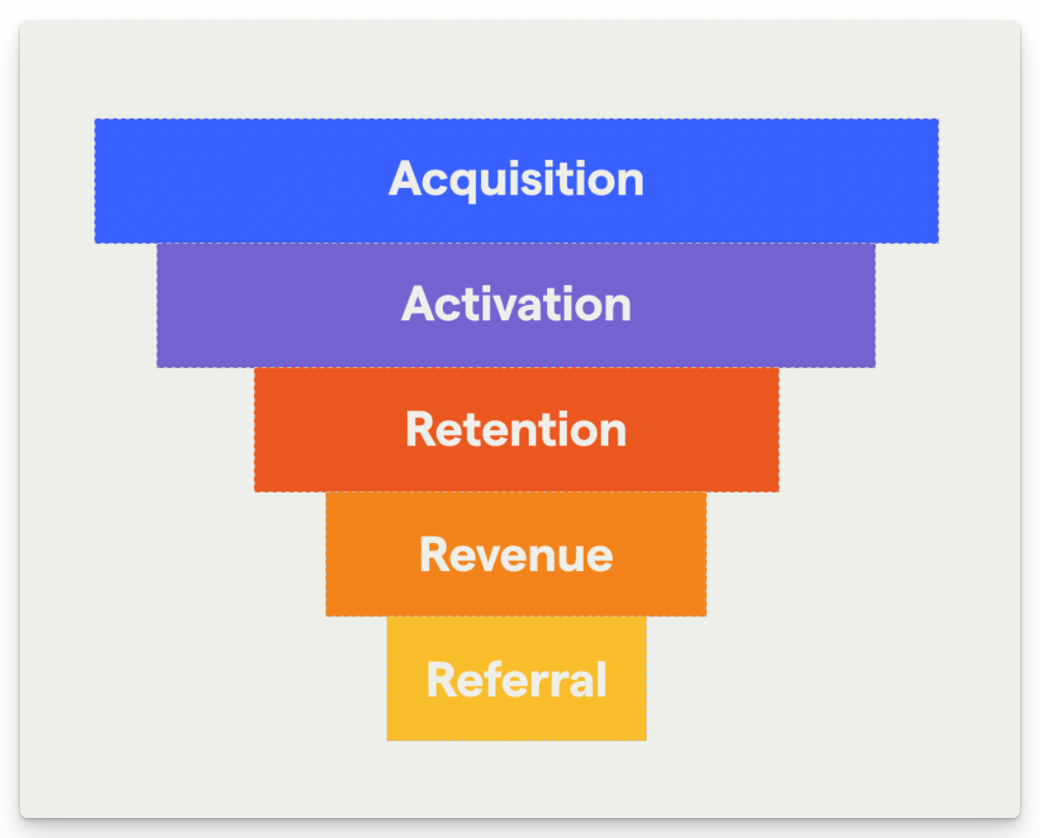
Let’s break down the essential metrics into categories (stages of growth funnel). For each, we’ll explain what it measures, when to use it, and how to calculate it.
Acquisition Metrics
Acquisition metrics tell you how users find your product. They’re the starting point of your product’s growth funnel.
1 Customer Acquisition Cost (CAC):
- What it measures: The cost associated with acquiring a new customer. It includes marketing and sales expenses.
- When it's used: Used to evaluate the efficiency and effectiveness of marketing and sales efforts.
- How to calculate: CAC = (Total Marketing and Sales Expenses) / (Number of New Customers Acquired)
2 Traffic Sources
- What they measure: The origin of your website or app visitors (e.g., organic search, paid ads, referrals, social media).
- When it’s used: To understand which channels are most effective for reaching your target audience.
- How to analyze: Use tools like Google Analytics to break down traffic by source and assess the quality and conversion rates from each channel.
3 Sign-Up Rate
- What it measures: The percentage of visitors who complete a desired action (e.g., sign up, purchase) out of the total number of users who interacted with the product.
- When it’s used: In the early stages to gauge the effectiveness of your landing page and initial messaging.
- How to calculate: Sign-Up Rate=Number of Sign-Ups / Total Visitors × 100
Conversion Metrics
Conversion metrics track how effectively users move from initial interest to taking meaningful actions.
1 Activation Rate
- What it measures: The percentage of new users who perform a key action that indicates they’ve experienced the product’s core value (e.g., completing onboarding, sending a message, or setting up a profile).
- When it’s used: Early in the customer journey to determine if users understand and derive value from your product.
- How to calculate:
- Activation Rate=(Number of Activated Users) / (Number of New Sign-Ups) × 100
2 Time to Value (TTV)
- What it measures: The time it takes for a user to experience the primary benefit of your product.
- When it’s used: To optimize onboarding processes and reduce friction, ensuring users see value quickly.
- How to calculate: Measure the time from sign-up to the first key action (e.g., first purchase, first project completed) averaged over a cohort of users.
3 Drop-Off Rate
- What it measures: The percentage of users who exit the funnel at any given step.
- When it’s used: To identify problem areas in your conversion funnel.
- How to calculate: Drop-Off Rate = Number of Users Who Abandon a Step / Number of Users Who Enter the Step × 100
Engagement Metrics
Engagement metrics reveal how actively users interact with your product over time.
1 Daily Active Users (DAU) / Monthly Active Users (MAU)
- What they measure: The number of unique users who engage with your product daily or monthly.
- When it’s used: To assess overall product engagement and growth trends.
- How to calculate: Track unique logins or interactions on a daily and monthly basis; the DAU/MAU ratio (stickiness) is computed by dividing DAU by MAU.
2 Session Length
- What it measures: The average duration of a user session.
- When it’s used: To understand the depth of engagement and whether users are spending quality time with your product.
- How to calculate: Sum the duration of all sessions in a given period and divide by the total number of sessions.
3 Feature Adoption Rate
- What it measures: The percentage of users who use a new feature.
- When it’s used: After launching a new feature, to determine if it’s being embraced by your audience.
- How to calculate: Feature Adoption Rate = Number of Users Who Used the Feature / Total Users × 100
Retention Metrics
Retention metrics help you understand if users continue to derive value from your product over time.
1 Churn Rate
- What it measures: The percentage of customers who stop using your product over a certain period.
- When it’s used: Continuously, to monitor and mitigate customer loss.
- How to calculate: Churn Rate = Number of Customers Lost During Period / Total Customers at the Start of the Period × 100
2 Customer Retention Rate
- What it measures: The percentage of customers who remain active over time.
- When it’s used: To evaluate long-term customer loyalty and satisfaction.
- How to calculate:
- Retention Rate = ((Number of Customers at End of Period - Number of New Customers Acquired During Period) / Number of Customers at Start of Period) x 100
3 Net Promoter Score (NPS):
- What it measures: Customer loyalty and satisfaction by asking how likely customers are to recommend the product/service to others.
- When it's used: As a periodic survey, provides insights into overall customer sentiment and can indicate areas for improvement.
- How to calculate: Subtract the percentage of detractors (unhappy customers) from the percentage of promoters (happy customers).
- NPS = (Percentage of Promoters – Percentage of Detractors).
Revenue Metrics
Revenue metrics directly tie product performance to the bottom line. They’re crucial for understanding the financial health of your product.
1 Monthly Recurring Revenue (MRR)
- What it measures: The predictable revenue a business can expect on a monthly basis.
- When it’s used: To track overall business performance and forecast growth.
- How to calculate: Sum the recurring revenue from all active subscriptions within a month.
2 Average Revenue Per User (ARPU)
- What it measures: The average revenue generated per user over a given time period.
- When it’s used: To determine the revenue efficiency per customer.
- How to calculate: ARPU=Total Revenue in a Period / Number of Users
3 Customer Lifetime Value (CLTV)
- What it measures: The total revenue expected from a customer throughout their relationship with your product.
- When it’s used: To evaluate how much you can invest in acquiring new customers relative to the revenue they bring.
- How to calculate:
- CLTV = (Average Purchase Value * Purchase Frequency * Customer Lifespan)
Product Feedback & Optimization Metrics (bonus metrics)
These metrics help you refine your product continuously by incorporating user feedback and tracking product quality.
1 Customer Satisfaction Score (CSAT):
- What it measures: Measures customer satisfaction based on their experience with the product or service.
- When it's used: Post-interaction or after key product milestones. Provides feedback on product quality and customer service.
- How to calculate: Ask customers to rate their satisfaction on a scale (e.g., 1-5) and calculate the average score.
2 Bug/Issue Rate
- What it measures: The number of bugs or issues reported by users over a period.
- When it’s used: Constantly, to gauge product quality and reliability.
- How to calculate: Track the number of bug reports, then calculate the average per week or month. Compare against usage statistics to determine impact.
Bringing It All Together
Every product metric has its place in the story of your product. Here are a few final tips to maximize their impact:
- Integrate Metrics Into Your Decision-Making: Use real-time dashboards, cohort analyses, and regular review meetings to ensure that your teams are aligned with the key metrics.
- Avoid Vanity Metrics: Focus on actionable numbers rather than surface-level data that doesn’t drive real change.
- Iterate Constantly: As your product evolves, so should your metrics. Revisit and recalibrate them regularly to ensure they still align with your business objectives.
- Cross-Reference Data: Look at metrics in conjunction (for example, high acquisition but low retention might signal onboarding issues).
Conclusion
Understanding product metrics isn’t just about collecting numbers, it’s about translating data into action. With this guide, you now have the tools to:
- Decipher which metrics truly matter for your product’s lifecycle
- Know when and how to use them effectively
- Calculate them to drive informed, strategic decision
By integrating these metrics into your everyday workflow, you’ll move from reactive decision-making to proactive, data-driven product management.